The plotting module provides a bunch of plotting widgets to imgui. We use the implot library to handle this functionality.
Enabling the module
To enable the plotting module, update your uvproj.yaml
so that the plotting key under enabled-modules
is set to true like this:
name: "MyProject"
version: "1.0.0.0"
engine-version: "1.0.0.0"
enabled-modules:
  plotting: true
Then, regenerate the modules cache by running the following command:
user $ https://madladsquad.com/UVKBuildTool --generate <project directory>After that, refresh your CMake project with
cmake ..!
Next, in your source file, include the Modules.hpp
header in your components like this:
#include <Modules/Modules.hpp>Event safety
The entire module is flagged as event safe at
All ready.
Testing out the module
In one of your widgets, add the following code to your tick function:
ImGui::SetNextItemWidth(250);
if (ImPlot::BeginPlot("##Pie1", ImVec2(350, 350), ImPlotFlags_Equal | ImPlotFlags_NoMouseText))
{
static const char* labels[] = { "Data 1", "Data 2" };
double dt[] = { 10.0f, 12.0f };
ImPlot::SetupAxis(ImAxis_X1, nullptr, ImPlotAxisFlags_NoDecorations);
ImPlot::SetupAxis(ImAxis_Y1, nullptr, ImPlotAxisFlags_NoDecorations);
ImPlot::SetupAxesLimits(0, 1, 0, 1, ImPlotCond_Always);
ImPlot::SetupLegend(ImPlotLocation_North | ImPlotLocation_West, ImPlotLegendFlags_Horizontal);
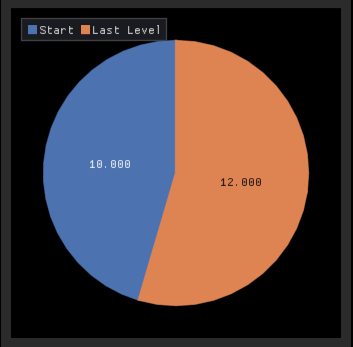
ImPlot::PlotPieChart(labels, dt, 2, 0.5, 0.5, 0.4, "%.3f", 90.0f, ImPlotPieChartFlags_Normalize);
ImPlot::EndPlot();
}and if you run your application, you will get some type of output like this:
Learning the module
To learn more about using implot, check out the implot GitHub repository.
Checking for the module
To check for the module at compile time, use the
UIMGUI_PLOTTING_MODULE_ENABLED macro.
Runtime checking can be done using the plotting member
of the ModuleSettings struct. More info can be found here.
- Home
- Beginner content
- Install guide
- Creating and using the UI components
- The Instance
- The Init Info struct
- Building better titlebar menus
- Textures
- Logging
- Unicode support
- Additional features
- Client-side bar
- Custom type definitions
- Memory management
- C API development
- Config files and Folders
- Interfaces
- Internal Event safety
- Customising the build system
- Modules system
- Collaborating with others
- Advanced content
- Loading dynamic libraries at runtime
- Understanding the library layout
- Compilation mode modifiers
- Supporting plugins
- Production export and deployment
- OS integration tips
- Targeting WASM
- Using a custom rendering engine:
- Using a custom windowing backend:
- Developer and contributor resources
- Misc